
Bear Pennant Shows Ethereum May Break Down
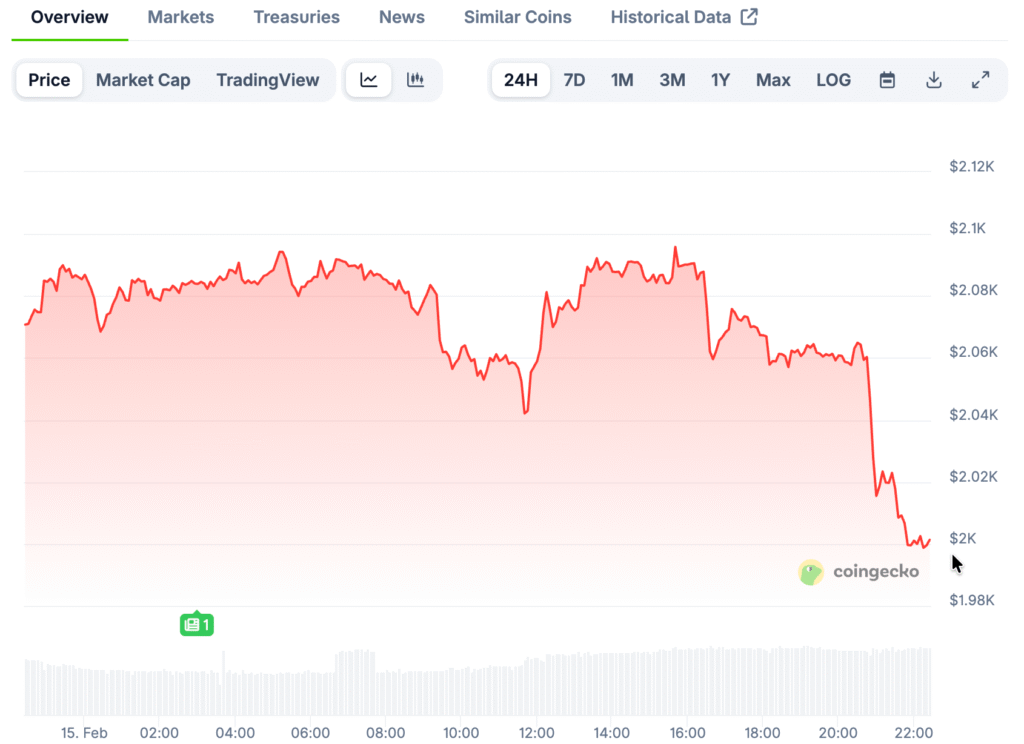
After a big drop in February, Ethereum is once again at risk of going down because a classic bear pennant is forming on the daily chart. The token fell from over $2800 to the $1900–$2000 range, which set the flagpole for the pattern. Technical analysts think this setup is important.
Since then, the price action has formed a narrowing triangle with lower highs and slightly rising lows. These kinds of patterns often break in the direction of the previous trend, which is still bearish. Momentum seems weak.
Threat to Key Support Level Near $1950
Market experts say that pennant support around $1950 is the most important short-term level for traders. A clear break below that level could confirm that the larger downtrend will continue. Technical triggers are important.
If the pattern resolves downward, the measured-move projection aims for about $1200. That situation means that prices could drop by about 40% from where they are now, which makes everyone more cautious. Risk is still high.
Signs Show Buyers Still Don’t Have Control
Ethereum is still trading below the 50-day and 200-day exponential moving averages, which are now acting as overhead resistance. Staying below these signals usually means that bearish sentiment will continue. The trend direction is still down.
The relative strength index, on the other hand, has bounced back from being oversold but is still below the neutral 50 mark. This positioning suggests that buyers don’t have enough momentum to stop the decline. There isn’t much confidence.
Recommended Article: Ethereum Weekly Chart Signals Stress As Key Support Breaks
Big Whale Transfer Increases Sell Pressure Concerns
Arkham Intelligence’s blockchain analytics found wallets with the name “Garrett Jin” that deposited 261024 ETH, worth about $543 million, into Binance. Transfers happened quickly across several tranches, which caught the market’s attention right away. Size is important.
Even though we don’t know who the wallet owner is, the clusters point to a single controlling entity. When things move this much, people often start to wonder if they are going to go out of business. Traders are paying close attention.
Exchange Deposits Often Precede Market Volatility
When big transfers go to centralized exchanges, assets are usually closer to being immediately liquid, which can put more pressure on the sell side. The possibility of instant sales can change people’s feelings, even if they don’t happen. The psychology of people drives markets.
Analysts will keep an eye on whether the funds are spread out across exchange wallets or stay in one place. If people can see selling, it could make bearish momentum stronger. If people don’t do anything, it could start short-covering rallies. Results are different.
ETF Outflows Show Weak Demand from Institutions
According to Glassnode, the 30-day average of net flows for Ethereum spot ETFs has been negative for most of the last 90 days. When there are persistent outflows, it usually means that institutions are losing interest. It looks like support is weak.
When demand is low, it’s harder for the market to handle big deposits or keep prices going up. Rebounds may have trouble getting going without more money coming in. Liquidity is important.
Market Awaits Confirmation Of Next Major Move
If the price breaks above the pennant resistance, it would break the bearish structure and possibly bring back bullish confidence. Traders are still being careful until then, when technical and on-chain signals come together. There is a lot of uncertainty.
The direction of Ethereum’s price will likely depend on institutional flows, macro sentiment, and whale behavior. The next few sessions could be very important for the direction of the trend. It is expected that things will be volatile.