
ETH Extends Recovery Into Pivotal Resistance
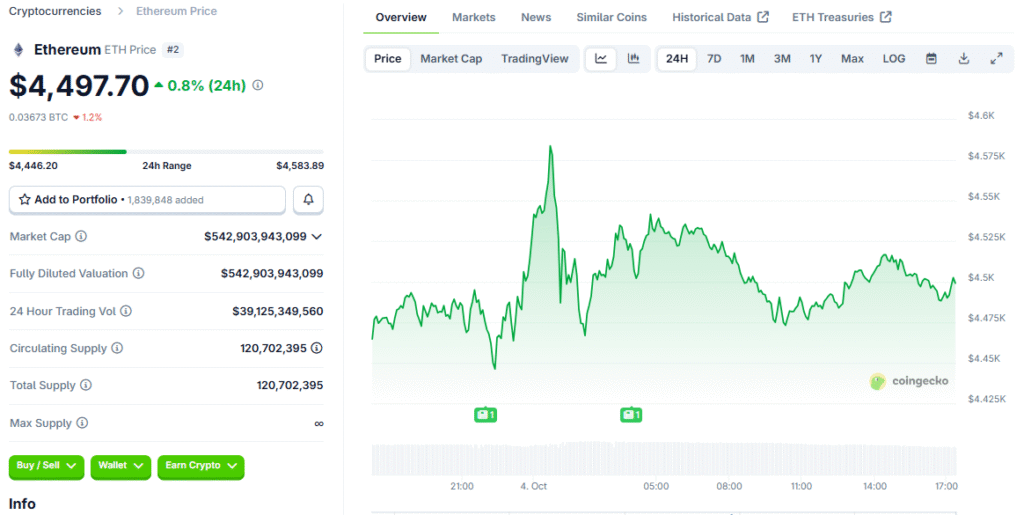
Ethereum pushed to $4,500 after reclaiming its 50‑day simple moving average, extending a multi‑session advance. The level has capped price for weeks, making the current test a key gauge of trend strength.
Momentum built despite September’s drawdown, reflecting constructive spot demand. Traders now watch whether ETH can convert resistance into support and sustain a higher‑high structure.
Whales Add 840,000 ETH Since Mid‑September
Addresses holding 10,000–100,000 ETH accumulated roughly 840,000 ETH since September 18, per CryptoQuant. Dip‑buying from this cohort historically aligns with durable recovery phases and trend continuation.
Some large holders booked partial profits into strength, but net flows remain positive. Persistent bid depth from whales often buffers volatility during resistance challenges.
Accumulation Addresses Set A Monthly Record
Wallets with no selling history added a record 5.6 million ETH in September, marking a third straight monthly high. This cohort’s behavior signals conviction‑driven buying, less sensitive to short‑term swings.
Serial records from non‑selling addresses suggest structural positioning. Such flows typically underpin medium‑term uptrends by removing supply from exchange circulation.
Spot ETFs Log Three Straight Days Of Inflows
U.S. spot ETH ETFs posted three consecutive sessions of net inflows totaling $755.2 million, per SoSoValue. This refocus on spot exposure complements on‑chain accumulation, strengthening the bull narrative.
ETF demand is particularly impactful during resistance tests, where marginal buyers can tip balance. Sustained inflows historically correlate with improving market breadth and depth.
Recommended Article: Ethereum Market Faces Turbulence Yet Institutional Support Grows Stronger
Derivatives Lag, Pointing To Spot‑Led Advance
Open interest stayed relatively muted during the rebound, indicating limited leverage contribution. A single‑day 280,000 ETH jump hints at returning risk appetite but remains modest versus prior peaks.
Spot‑led rallies tend to be sturdier, with fewer liquidation cascades. If OI rises gradually alongside price, the structure can support trend persistence rather than fleeting squeezes.
Technical Map: Supports And Upside Triggers
Immediate resistance sits at $4,500, with a descending trendline just above. A decisive break and hold opens a path toward $4,835, with follow‑through eyeing prior cycle highs thereafter.
On weakness, $4,100 and the 100‑day SMA provide key downside references. Holding those levels would preserve the series of higher lows defining the recovery.
Liquidity Events Reflect Ongoing Rotation
Roughly $129.9 million in futures positions were liquidated over twenty‑four hours, including $106.2 million in shorts. This cleansing helped reset funding and cleared overhead supply pockets.
As positioning normalizes, constructive flows can drive cleaner impulses. That dynamic favors methodical breakouts over unstable, leverage‑driven spikes.
What To Watch Next
Monitor whale accumulation continuity, ETF flow persistence, and OI pacing versus price. A weekly close above $4,500 would validate trend strength and invite momentum participation.
Failure there likely returns price to the $4,100–$4,250 demand zone to rebuild energy. For now, the balance of evidence favors a spot‑supported, patient push through resistance.