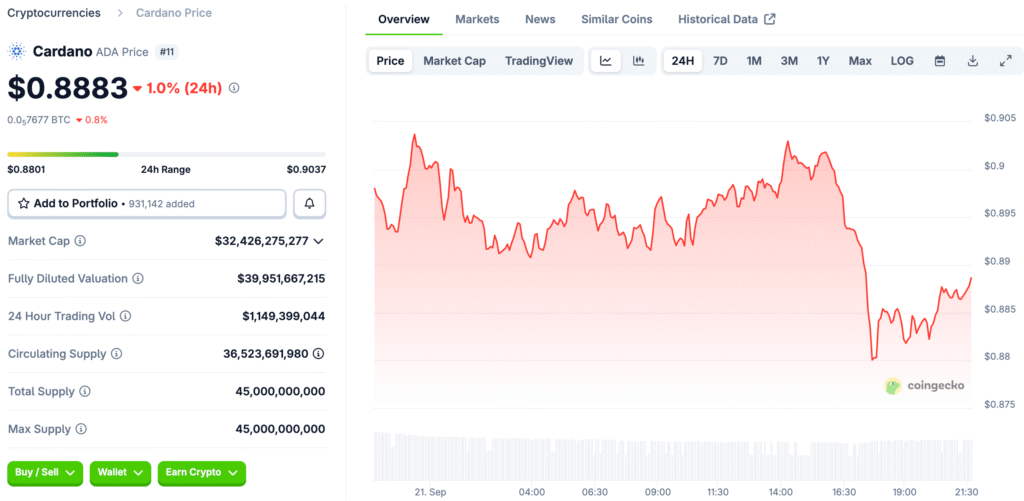
Cardano Builds Momentum Above $0.93
Cardano’s price recently broke through the $0.93 resistance level, which means it is getting stronger again after weeks of staying the same. This breakout has made bullish traders even more sure of their position, and they are now watching $0.95 as the next important test that could decide ADA’s short-term direction.
Since August, ADA has been following a steady upward trendline on the daily chart, which is a bullish sign. Higher lows and volume spikes on green candles show that buyers are always stepping in on dips to protect the uptrend.

Resistance at $0.95 and Path Toward $1.00
Analysts say that ADA needs to break through the $0.95 barrier in order to start a run toward the $1.00 psychological level. Getting through this resistance would be a big step forward, turning $1.00 into the next place where buyers and sellers will fight.
If ADA gets back to $1.00, it could start more upward movement and strengthen the long-term bullish outlook. But if it falls below $0.95, it could cause short-term pullbacks that test the ascending trendline support again.
Long Positions Dominate Market Structure
New positioning data shows that ADA longs are firmly in charge, with big accounts making a lot of money. The biggest long position, worth $4.68 million, has gone up almost $1 million. The second-biggest long position, worth $1.35 million, has gone up more than 25% since it was opened.
In contrast, short positions have lost a lot of money, between -6% and -24%, which shows how sure ADA is about its bullish breakout. This imbalance makes the case for more upside stronger because shorts have to cover their positions as prices go up.
Recommended Article: Cardano Price Rises on Bank Integration and ETF Approval
Fibonacci Levels Indicate Long-Term Expansion
Fibonacci extensions show that ADA has big price goals on the long-term chart. According to analyst Ali Martinez, Cardano hit its highest point at the 1.272 Fib level during the last cycle. This could happen again in the current rally.
The next phase of growth seems to be starting now that ADA is above the 0.236 retracement zone, which is between $0.88 and $0.93. If historical patterns hold true, Fibonacci projections suggest that prices could rise into the $3–$6 range.
Whale Activity Poses a Short-Term Risk
Even though bullish structures are forming, ADA is having trouble because whales are selling a lot of it. Reports say that almost 530 million ADA were sold in the last 48 hours, which tests how strong the recent breakout was.
Heavy distribution like this often makes people want to sell right away, which slows down rallies and makes buyers take in new supply. Still, ADA’s trendline support and strong long positioning suggest that it will stay strong as long as demand stays strong.
Technical Indicators Stay Constructive
Technical indicators still point to bullish outcomes, and the RSI is still in a neutral range, which means there is room for more upside. Volume trends show that people are still interested in buying, and moving averages show that the overall trend is still going up.
Momentum oscillators suggest that there will be periods of consolidation before possible breakouts. This is a good sign that ADA’s rally could continue once buyers regain control at resistance levels. These signs show that ADA has a strong case for being bullish.
Cardano Traders Watch $0.95 Breakout to Confirm Rally Continuation
Cardano’s rise above $0.93 has boosted the market, with targets of $0.95 and $1.00. Longs are making money, while shorts struggle, pushing momentum towards gains. If buyers can hold onto current supports and push ADA through $0.95, the way to $1.00 and Fibonacci targets of $3-6 is still open.
However, if trendline support doesn’t hold, momentum could slow down and ADA return to consolidation. ADA traders are cautiously optimistic, weighing whale distribution against technicals and market structure.


