
Ethereum Drops Sharply Every Month Due To Heavy Market Pressure
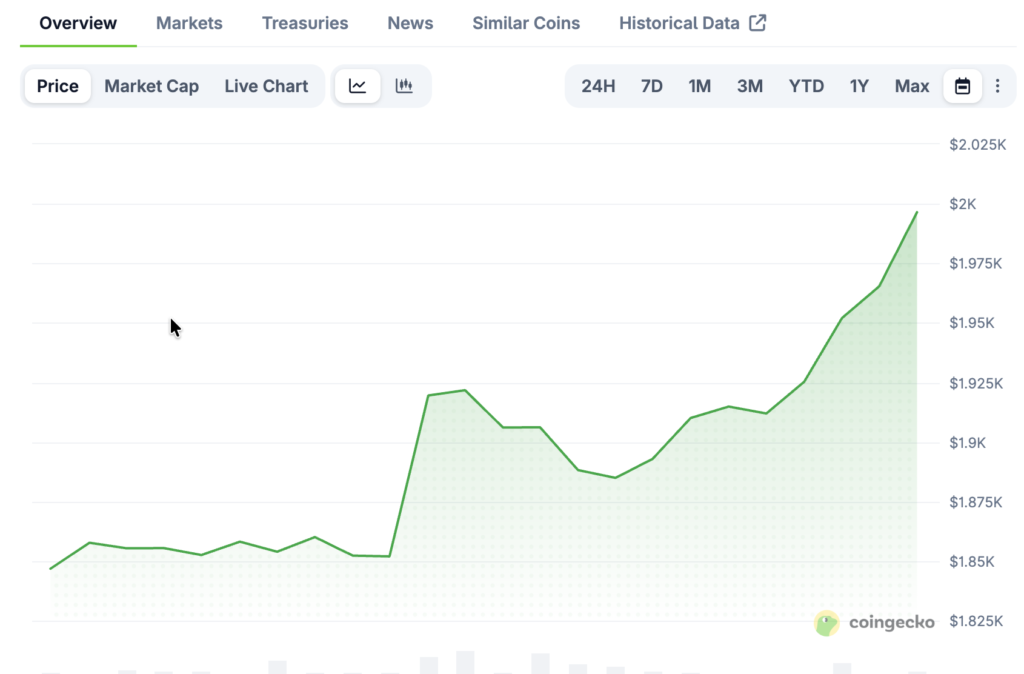
Ethereum USD continues to trend lower after falling more than 26% over the past month. ETHUSD is currently trading near $1,851 while testing major support levels. Market participants are closely monitoring price action as volume remains elevated and volatility increases.
The decline reflects persistent selling pressure across broader cryptocurrency markets. Rising liquidation activity has amplified downward momentum throughout the month. Traders are assessing whether Ethereum can defend key support near the lower Bollinger Band.
Technical Indicators Signal Ongoing Structural Weakness
Technical indicators point to sustained downside risk in the current structure. The RSI near 41 suggests neutral momentum rather than deeply oversold conditions. Meanwhile, the MACD remains firmly bearish with continued negative histogram pressure.
An ADX reading above 47 indicates strong trend conviction among sellers. ETHUSD trades well below both its 50-day and 200-day moving averages. These technical gaps highlight deteriorating structure requiring stronger catalysts for reversal.
Forecast Models Outline Possible Short-Term Lows
Projection models suggest multiple scenarios depending on volatility and sentiment shifts. Near-term forecasts indicate a potential monthly low around $1,370. This level aligns with prevailing technical weakness across timeframes.
Quarterly projections suggest recovery toward $2,731 if broader conditions improve significantly. Longer-term annual outlooks anticipate stabilization and gradual appreciation. However, these projections remain highly dependent on macro sentiment changes.
Recommended Article: Vitalik Buterin Sells $7M In ETH As Ethereum Price Declines
Market Sentiment Remains Cautious Amid Elevated Trading Volume
Elevated trading volume indicates sustained market participation despite declining prices. Relative volume readings near double average levels reflect active engagement from buyers and sellers. Institutional interest persists given Ethereum’s significant market capitalization.
Sentiment remains defensive as leveraged liquidations continue affecting positioning. Neutral RSI readings leave room for either stabilization or additional downside pressure. Traders identify $1,581 as a critical pivot level in current conditions.
Large Holder Activity Adds To Downward Pressure
On-chain data shows increased distribution from major Ethereum holders. Reports indicate that prominent wallets sold over 10,000 ETH during February. Concentrated selling has weighed heavily on monthly performance.
Breaks below major moving averages confirmed transition from accumulation to distribution phases. Year-to-date declines exceeding 30% underscore broader macro challenges. Combined structural and technical weaknesses now constrain price stability.
Support And Resistance Levels Define Next Move
Key support levels are forming near $1,581 and $1,800. A breakdown below the lower Bollinger Band could push prices toward the yearly low near $1,383. Forecast targets around $1,370 closely align with these structural zones.
Resistance remains firm near $1,868 and $2,091. These thresholds coincide with recent highs and mid-range Bollinger metrics. A sustained breakout would signal improving momentum toward the 50-day average, though recovery remains challenging.
Outlook Suggests Risk Of Further Declines Before Stabilization
Ethereum USD remains technically vulnerable following significant monthly losses. Strong ADX confirmation supports continuation of prevailing downtrends absent a sentiment shift. RSI positioning allows for either consolidation or renewed selling waves.
Forecasts indicate potential capitulation before meaningful recovery attempts emerge. Traders continue monitoring major support zones for reversal signals or deeper breakdown risk. Despite short-term weakness, Ethereum remains closely tracked due to its systemic importance.