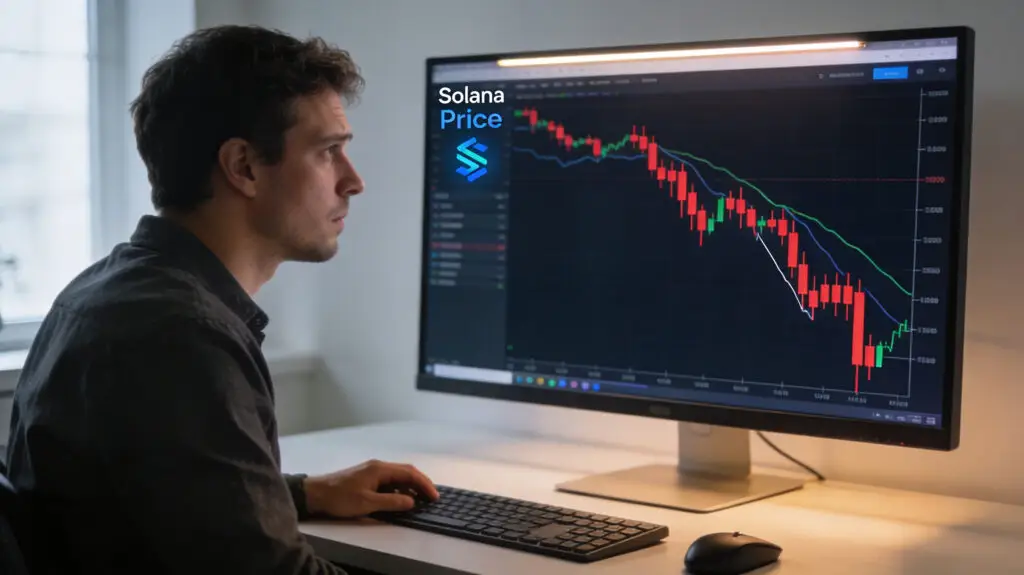
Solana Price Hits Important Technical Levels Close To $90
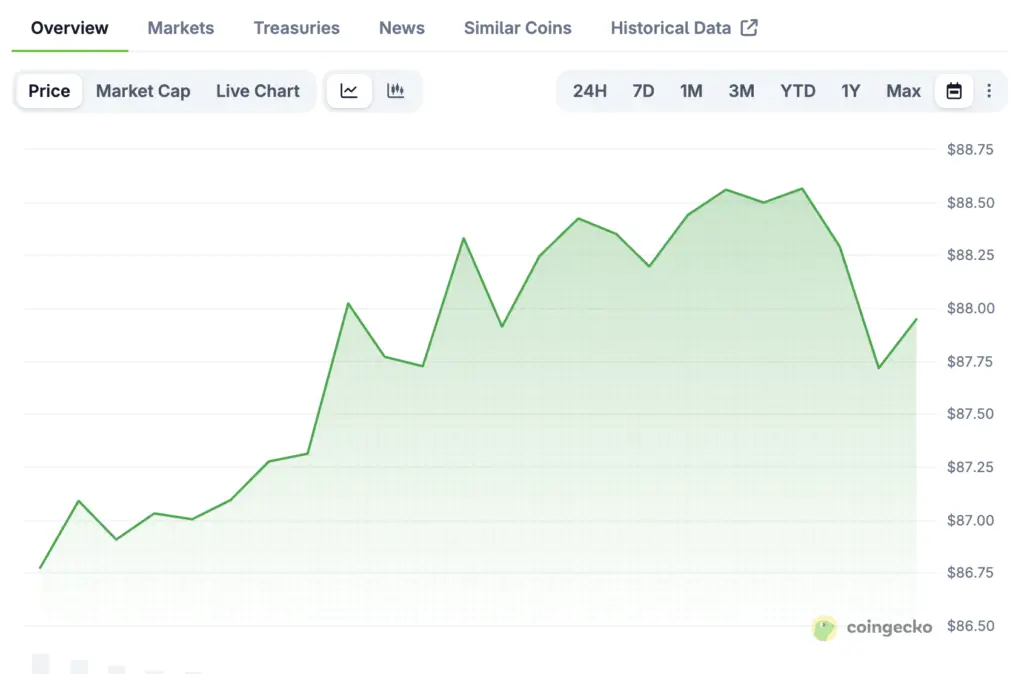
The price of Solana USD is around $88.35 as traders try to figure out if the current momentum can keep the recovery going above recent resistance levels. The asset went up 1.74% today, but traders are still being careful because some technical indicators show that the market is sending mixed signals. Analysts say that Solana is now in a crucial time when breaks in support or resistance could decide which way the price will go in the short term.
Even though the gain was small, market momentum indicators show that the rally doesn’t have a lot of institutional support or conviction. The daily trading volume was only 34.96 million, which is much lower than the average of about 158.62 million in recent times. When prices go up, lower volume can mean that the momentum is weak and the market may be able to handle downside pressure.
Technical Indicators Reveal Mixed Momentum For Solana
Right now, technical indicators are giving us mixed signals about where Solana’s price will go in the short and medium term. The Relative Strength Index is at 47.76, which means that the market is neutral and there aren’t any clear signals that it is overbought or oversold. This reading usually means that the market is consolidating instead of moving strongly in one direction.
The Moving Average Convergence Divergence indicator, on the other hand, shows a bearish signal even though the histogram momentum is slightly positive. The MACD line is still below its signal line, which shows that the overall trend is still going down. Traders pay close attention to these indicators because they often come before bigger price movements in one direction.
Bollinger Bands Show That Prices Can Move
Price action compared to Bollinger Bands puts Solana close to the middle band at about $85.19. The upper band is now close to $91.58, and the lower band is around $78.81, where it acts as support. This setup shows that the asset can still move a lot in either direction.
When the price stays close to the middle band, the markets often go into consolidation before a breakout happens. If Solana goes above the upper band, bullish momentum could pick up speed quickly. But a move toward the lower band could make it harder to sell short-term trading positions.
Recommended Article: Ethereum Foundation Sells 5,000 ETH In $10.2M Treasury Deal
Market Sentiment And Trading Activity Remain Cautious
Indicators of market sentiment show that traders are still being careful, even though prices have stabilized recently. The Money Flow Index is close to 49.44, which means that money is coming in at a steady rate without any strong signs of accumulation. This number shows that investors are not quickly buying or selling positions.
Other signs also suggest that people in the market should be careful in the short term when looking at Solana price movements. The Commodity Channel Index is currently at 124.14, which means that prices have been going up recently and are now temporarily overbought. In the past, readings like these have come before short pullbacks or periods of consolidation in larger market trends.
Forecast Models Aim For A Possible Drop To $71.94
Forecast models that look at more than 1 time frame say that Solana might test lower support levels in the next few months. Monthly forecasts say that the price could drop to around $71.94, which is about 18.5% below the current price. This level is in line with historical support zones and bands with lower volatility.
However, longer-term forecasts show much more positive outcomes depending on the state of the overall market. Quarterly forecasts put consolidation at around $85.05 as traders look at changes in the macroeconomic and cryptocurrency markets. These predictions show how uncertain the digital asset markets are right now.
Long-Term Outlook Shows Possible Ways To Get Better
Even though the price has been weak lately, long-term forecasts are much more positive for Solana. If good things happen in the cryptocurrency ecosystem, yearly projections say that it could recover to $209.33. This goal means that prices will have to rise by more than 136% from where they are now.
For this kind of growth to happen, the network would probably need to be more active, more developers would need to join, and the mood in the cryptocurrency market would need to be better. Institutional adoption and good changes in the rules could also speed up the flow of money into the Solana ecosystem. Analysts say that these predictions are very dependent on changes in the economy and the industry as a whole.
Key Support And Resistance Levels That Traders Watch
Several technical levels are now important for deciding how the price of Solana will move in the next few weeks. There seems to be immediate resistance around $88.89 and $91.58, where prices have been rejected in the past. If the price breaks out above these levels, it could test the 50-day moving average near $93.09.
On the downside, support zones are close to $87.60, $85.19, and the lower Bollinger Band, which is close to $78.81. If prices break below these levels, selling pressure could pick up and push prices toward the $71.94 target. Traders keep a close eye on these price zones because they could mean a change in the trend.