Solana Price Gains Strength Again In The Crypto Market
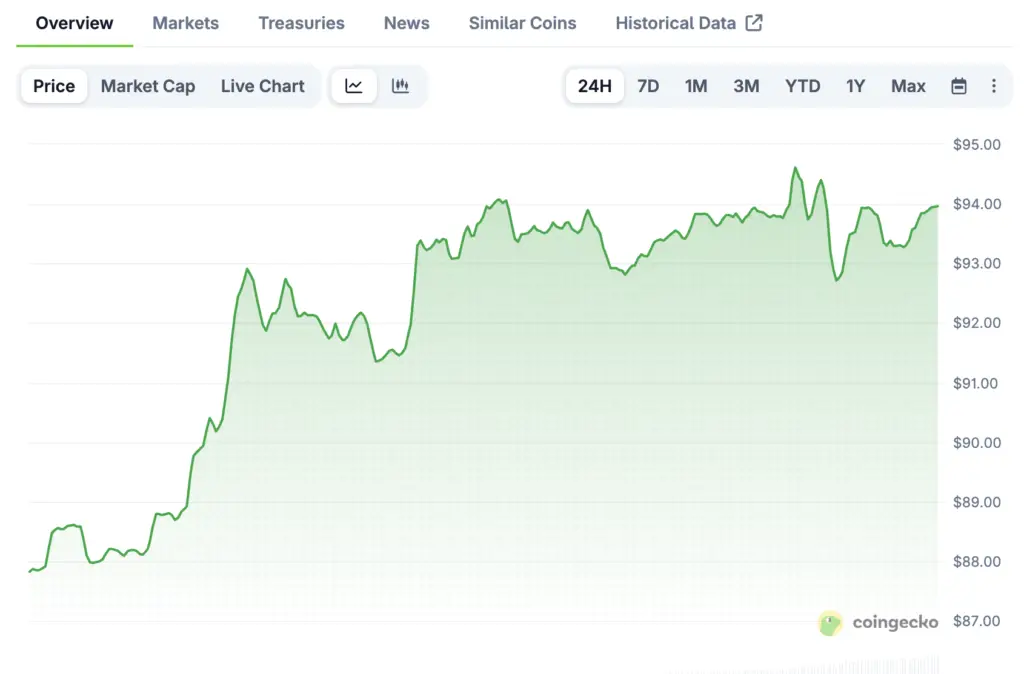
On March 16, Solana USD is trading near $93.8, which means it is gaining momentum again. Over the past 24 hours, the token went up about 2.19%, and over the past week, it went up about 8.01%. As technical signals get stronger, more and more people in the market keep an eye on the asset.
The cryptocurrency is worth about $50.1 billion on digital asset exchanges around the world. During the rally, trading activity has gone up a lot compared to recent averages. More people taking part means that traders are setting up around levels where a breakout could happen.
Technical Indicators Show Strong Trend Formation
Even though momentum indicators are neutral, technical indicators show that a trend is starting to form. The Average Directional Index is currently around 30.63, which usually means that the market is moving in a strong direction. Traders and institutional participants often have strong directional beliefs when they see these kinds of readings.
The Relative Strength Index, on the other hand, is at about 47.76, which puts it firmly in the neutral zone. This means that neither extreme buying pressure nor oversold conditions are currently in charge of the market. When the momentum is neutral, the asset can go up or down.
Bollinger Bands Show A Slight Bullish Bias
According to technical charts, Solana is currently trading above the middle Bollinger Band, which is around $85.19. The upper band is about $91.58, and the lower band is about $78.81. This position often means that there is a mild bullish bias in a larger range of consolidation.
When prices hold above the middle band traders often interpret the move as early bullish momentum. But the distance from the upper band is still pretty small during this rally. Because of this, resistance levels may still keep short-term growth in check.
Recommended Article: Solana Rises As Mastercard Partnership Signals Crypto Growth
Trading Volume Reflects Rising Market Participation
There is more and more trading activity as traders look at Solana price changes. The daily trading volume was about 70.1 million, which is more than usual. The relative volume was about 1.46 times higher than the recent average.
When more people trade, it usually means that more people are interested in what the market is doing and are thinking about how prices might change. More activity also makes liquidity better on all cryptocurrency exchanges. These things usually draw in more traders looking for short-term chances.
Mixed Sentiment Appears Across Market Indicators
Even though prices are going up, sentiment indicators show that buyers and sellers are in a balanced market. The Commodity Channel Index is currently at about 124.14, which means that the market is temporarily overbought. In the past, these kinds of readings have sometimes come before periods of consolidation after prices went up.
The Stochastic oscillator is still in the middle range, close to 63.85. This reading stays away from the extremes that usually come before a market reversal. These signs together point to cautious optimism rather than a strong bullish mood.
Forecast Models Suggest Diverging Price Scenarios
Analysts look at different time frames when making price predictions, which leads to different outcomes. If profit taking picks up speed, monthly projections say the price could drop to $71.94. This drop would be about 23.3% lower than the current price levels.
Long-term predictions for Solana’s future value seem much more positive. Quarterly forecasts say that the price will stabilize around $85.05, while yearly forecasts say it will go up to about $209.33. These different scenarios show how uncertain the cryptocurrency market cycles are.
Key Support And Resistance Levels Are Still Very Important
Traders who are keeping an eye on Solana’s price movement in the next few weeks should pay attention to a few technical levels. The lower Bollinger Band shows that immediate support is close to $78.81. If the price breaks below that level, it could cause more selling pressure.
Resistance may form on the upside near the $91.58 level and above the $100 level. If these barriers are broken, momentum traders and algorithmic buying strategies might be interested. So, people in the market keep a close eye on these levels to see if they confirm the next trend.