Solana Price Shows Parallels With BNB’s Rally Patterns
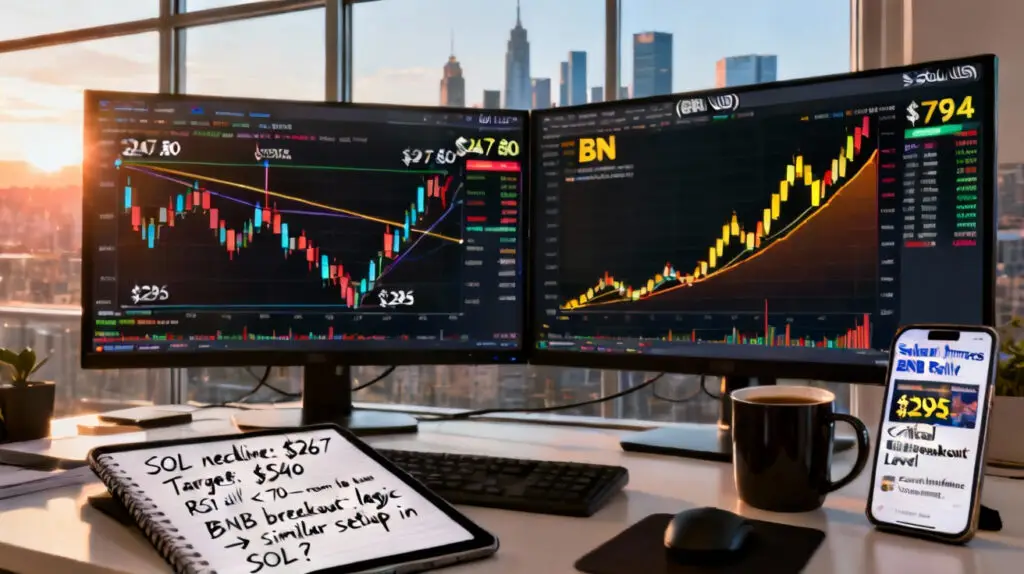
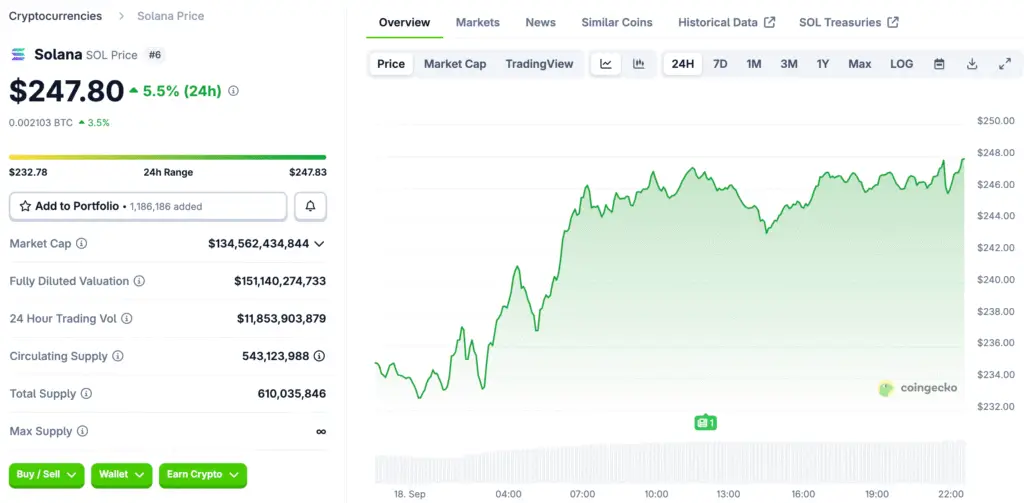
Solana is trading close to $247.80, which is similar to the way BNB’s price rose before it broke through the $1,000 mark. Weekly charts show that the market acted the same way, with rallies, consolidations, and new liquidity inflows that strengthened strong continuation patterns.
In August 2025, BNB broke out and quickly pushed prices above their previous highs. Solana is now testing structures that are similar, which raises expectations by a lot. Chart analysts say that these repeating paths show how investors think, since cycles tend to rhyme across major altcoins all the time.
Solana Looks to Break Through the $295 Resistance Zone
SOL is having trouble getting past $295, which is similar to BNB’s earlier important level at $794, which marked the start of its rapid rise. If Solana breaks through this level, it could start a new phase of momentum that could take it to new, unexplored valuation levels.
Analysts say that in a few weeks, the market will go up by 20%. This is possible if liquidity stays high and consistent, which is what momentum accumulation suggests. Traders are waiting for confirmation above $295 and are looking for renewed interest that shows structural strength across Solana’s weekly charts.
Historical Comparisons Back Up Positive Solana Predictions
The quick rise of BNB is a model. Within weeks, its rally broke through psychological barriers, setting new record highs in a way that worked. In 2017, Ethereum’s earlier cycles followed similar patterns: they went up sharply, then stayed the same, and then broke higher toward exponential upside.
Bitcoin’s historical 2013 cycle had almost identical reaccumulation phases, showing that major assets in cryptocurrency markets move in a consistent rhythm. Solana now seems to be in this rhythm, which is drawing in bullish traders who trust past patterns to help them figure out what the price will be.
Recommended Article: Solana Struggles Despite $500M Treasury Boost in Volatile Market
Cup and Handle Formation Signals Continuation Potential
The weekly chart for Solana shows a perfect cup and handle pattern. The cup lasts from 2021 to 2023, and the handle stays the same until 2025. This bullish structure makes the neckline resistance level at $267. Repeated tests since 2024 show how important it is for confirming upward breakouts.
Once the neckline clears decisively, technical analysis aims for $540. This projection says that there is a 120% chance of an upside through the end of the year. If Solana keeps up its momentum, it could rise in a parabolic way like BNB, which would make traders and investors more optimistic about the long term.
Relative Strength Index Supports Upside Continuation Case
Even though it has gone up, RSI is still below seventy, which means that Solana still has room to go up without getting too high yet. This momentum indicator agrees with bullish setups, which adds to the evidence for continuation scenarios on medium- and long-term charts.
Traders feel better when the RSI numbers are healthy. Solana’s technical posture is still balanced, unlike overextended rallies, which means that bullish momentum can keep growing. This makes people more sure that breakouts above the neckline will hold, which supports projections for a multi-month rally beyond the current resistance zones.
Investor Psychology Drives Reaccumulation and Breakouts
Patterns in how the market acts show that psychology is still important. Initial rallies get things going, consolidations shake out weaker hands, and liquidity inflows keep the climbs going. Solana’s ongoing consolidation is similar to this framework, with investors waiting for catalysts to confirm that the price can break out above short-term resistance levels.
This behavior happens in a cycle across assets. As BNB and ETH showed, these phases lead to strong continuations that pay off traders who are willing to wait. Solana’s cycle is similar to these past ones, which puts it in a good position to make more money if liquidity improves after the breakout is confirmed.
Solana Targets $540 Technical Projection for 2026
Solana’s breakout target of $540 means that the price would have to more than double from where it is now. Analysts think this prediction is realistic and possible. The target fits with historical cup and handle patterns, which gives you confidence that the pattern will hold up across different technical frameworks.
Execution is key to long-term projections. If Solana breaks through the neckline and keeps going up, traders expect it to grow quickly until early 2026. This prediction solidifies Solana’s place among the top altcoins and boosts market excitement for possible record highs in the future.