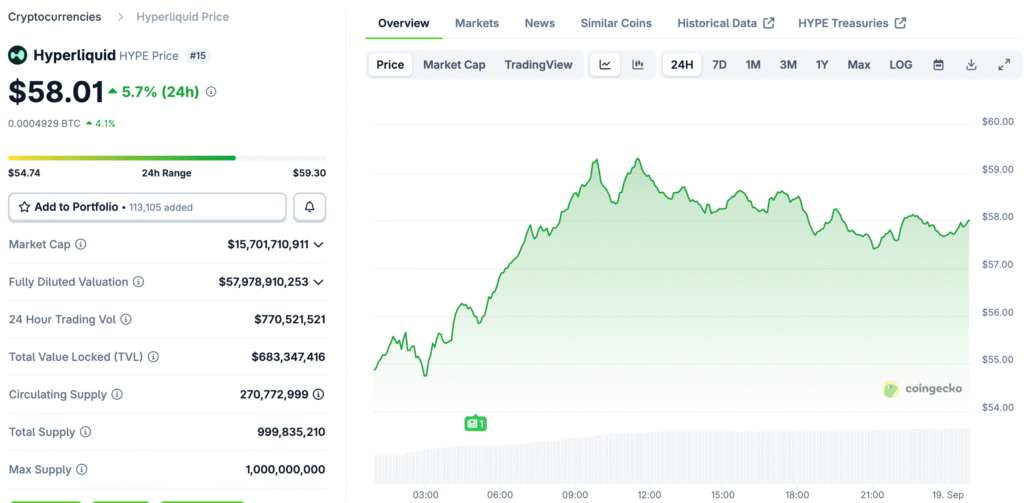
Hyperliquid Price Extends Rally to Fresh All-Time Highs
Hyperliquid hit a new all-time high of $58.01 today, continuing a parabolic rally that started to pick up speed in April. Earlier breakouts from the $35 level confirmed support in June, which set the stage for a steady rise in daily charts.
The price moved along an ascending parallel channel all summer. The breakout in September changed the course of the market, making the case for a renewed rise stronger. The price is still strong even though it went down a little. Consolidation phases keep giving traders who expect more breakouts in the future a boost.
Technical Indicators Support Continued Bullish Momentum
The relative strength index is going up without diverging, which means that bullish momentum is still strong even though prices have gone up sharply recently. MACD also supports continuation by showing an upward trend that fits with the faster momentum in the larger Hyperliquid trading market.
The lack of bearish divergences makes traders feel better. Technical setups are still good, which makes it more likely that the market will keep going up to new highs. Indicators are in line with the parabolic price structure, which means that cautious traders may not expect the momentum to last as long as it does.
Wave Count Analysis Indicates Elevated Objectives
Elliott wave analysis shows that Hyperliquid is close to the end of wave three in a five-wave upward sequence that started in August. Based on Fibonacci extension calculations of the length of the previous wave one, the first local top is expected to be around $64.46.
The next corrective wave, four, could retest the channel, which would give it a chance to settle down before the next upward phase starts again and heads toward new highs. Wave counts show that the overall bullish trend is still going strong, and pullbacks are seen as healthy resets in the structure that is moving forward.
Recommended Article: HYPE Price Targets New All Time High After Circle Expansion
Breakout From Parallel Channel Validates Bullish Strength
Hyperliquid broke out of an ascending channel in early September. The breakout was confirmed by a retest that acted as support before the climb continued. These kinds of moves show strength because previous resistance zones turn into long-term support zones that help the rally keep going.
Green icon retests show strong belief. Traders see confirmation as a sign that bullish setups are getting stronger, which encourages more people to join the trend. A change in pattern signals a new acceleration. Hyperliquid got back on track after some time of slower consolidation in the channel.
Pullback Risks Remain Despite Strong Uptrend Continuation
There is still a chance of short-term pullbacks. Before the next wave of bullish activity, local tops often come before consolidations, which reset indicators. Traders should keep a close eye on the $59–$60 areas. Rejections here could come before corrective moves that try to retest breakout channels below.
Still, corrective moves are seen as helpful. Healthy consolidations make things last longer and stop people from getting tired during aggressive parabolic rallies. Analysts are still hopeful. Long-term structures still favor moving toward new milestones above current records, even with corrections.
Momentum Indicators Show That There Are No Bearish Signals
RSI levels are still helpful. There are no signs of overbought conditions or divergences, which supports the argument that the rally is still technically sound. The MACD histogram keeps getting bigger in a good way. Bullish crossovers stay in line with rising prices, which shows that buyers are consistently strong.
Momentum is still the main driver. The fact that there are no weaknesses makes people think that higher price targets are still possible in the next few trading sessions. Indicators show that there is still room for Hyperliquid to grow as bullish wave patterns continue to grow overall.
The Parabolic Rise of Hyperliquid
Hyperliquid shows that it is still strong, and its technicals suggest that it will keep going up. Its wave counts also show that it will keep going up. Analysts point out that there is a chance of retracements. However, the structure and momentum of the trend suggest that the rally is likely to last longer than the recent high records.
Traders expect more breakouts now that the market mood has changed. Hyperliquid is still showing bullish momentum among the best-performing assets right now. The uptrend doesn’t seem to be over yet, which supports the idea of parabolic growth potential even though there are risks of short-term consolidations.