
Cardano Price Reaches a Key Position
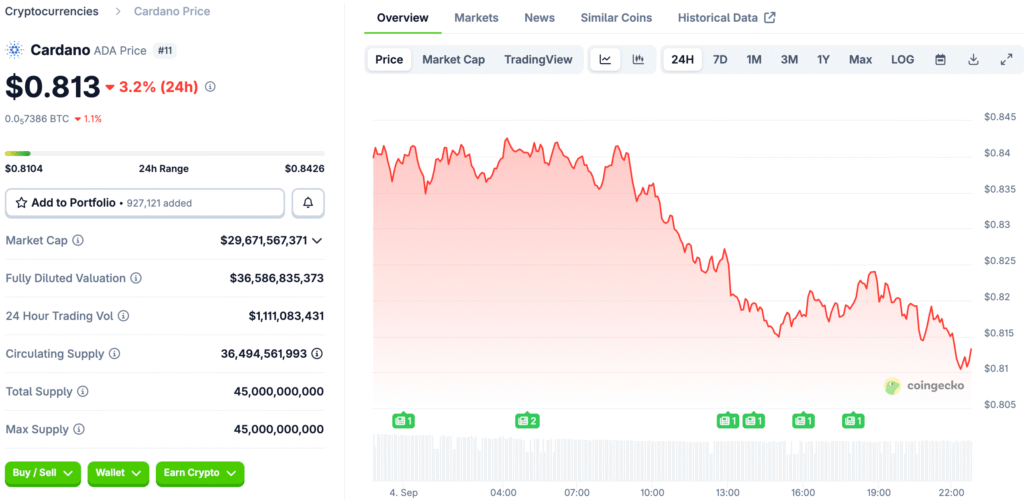
Recently, Cardano was worth $0.84. The token is now in a good place. It is above its most important moving averages. This suggests that it might go up.
The 50-day moving average is an important point. The price is higher than this. This confirms a long-term trend toward higher prices. The token is strong.
Looking at the Bullish Technical Setup
Analysts have set a price goal. They think the price might go up to $1.05. This would be a 25% increase. This is in line with a lot of models that make predictions.
ADA needs to break through resistance for this to happen. This is at the level of $0.95. This would probably start people buying more. It would make it possible to get to one dollar.
Bollinger Bands and Volume Metrics
The Bollinger Band analysis shows more. ADA is at 0.36 in the bands. This shows that it can go up. The price can go up to the upper band.
Volume metrics show that there is enough liquidity. This is necessary for movements to last. The stochastic oscillator says more. It shows that ADA is starting to come out of oversold conditions.
Recommended Article: Cardano Bounces at Demand Eyes Next Price Target
Cardano Founder Vindicated, Seeks Apology for False Claims
There is no longer a disagreement. There was a forensic review by a third party. There was no evidence to support the claims against IOG. The audit found Cardano to be clean.
The person who started Cardano said they were glad. He told the people who made the claims to say they were sorry. The resolution might clear up a big problem. This could make people feel better.
Getting to Know the Bullish Scenario
There are some important things that affect the bullish scenario. ADA needs to get above $0.95. This needs to happen with a lot of volume. The whole market needs to stay stable.
Conservative traders might want to hold off. They should wait for confirmation of volume. Traders who are more aggressive might buy now. They should look at the 50-day SMA as a guide.
Finding Important Stops and Resistance
The $0.95 resistance level is very important. For a rally, this level has to be broken. It all depends on the bullish case. It is the Bollinger Band on top.
The 50-day SMA is a stop-loss reference. This is at the price of $0.83. If this breaks below, it would be a bad sign. It would mean more risks on the downside.
Cardano’s Bearish Scenario: A Test of the 200-Day SMA
There is also a chance of a bearish scenario. ADA would have to not be able to hold support. The price of this support is $0.78. This could cause a drop to $0.68.
This would be a big risk for the downside. It would be in line with the 200-day SMA. If the price goes below the 50-day SMA, it would be bad. The bulls have the upper hand right now.