Bitcoin Struggles Near Critical Support Level
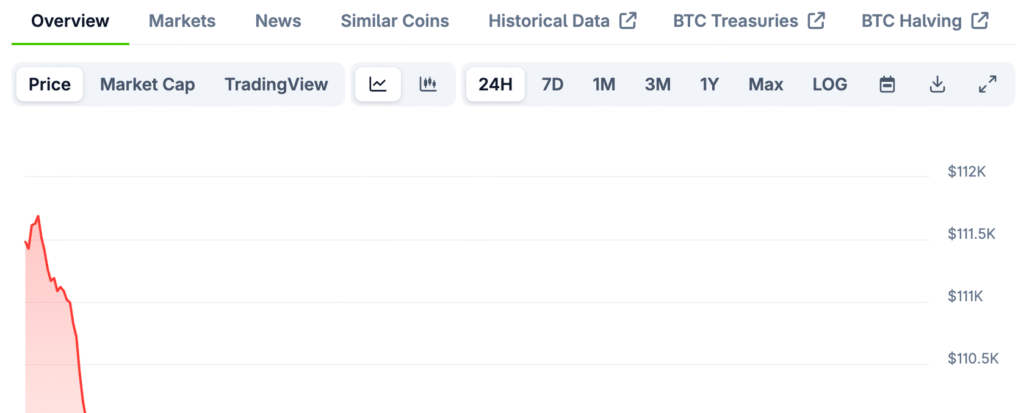
Bitcoin is worth about $111,248, with a market cap of $2.22 trillion and a daily volume of $51.78 billion. The price has gone up and down between $111,115 and $114,005, which shows that the market is unsure of its direction and there are mixed technical signals on different timeframes. Support at $111,000 is the key level that will decide which way the market goes in the short term.
Recent drops came after a reversal from highs near $117,968, which was marked by a head-and-shoulders pattern that was forming. Volume has dropped, which could mean that bearish momentum is losing strength. But if $111,000 isn’t defended, it could lead to deeper corrections down to $107,000.

Short-Term Charts Display Bearish Patterns
Bitcoin’s four-hour chart shows lower highs and lows, which confirms that the market is bearish in the short term. Resistance at $114,000 has repeatedly turned down price action, showing that sellers are still in charge in this time frame. Traders say that prices could drop even more if resistance stays strong.
If Bitcoin can get back to $113,500 with confidence, it could start a relief rally. But without strong volume, attempts to go up are likely to fail. Current momentum favors defensive strategies and careful positioning.
One-Hour Chart Reveals Indecisive Structure
The one-hour chart shows rounding top patterns, and the price is holding steady near important support levels around $111,115. Low trading volume means that the market is waiting for confirmation before making big moves. If it breaks below $111,000, the drop could speed up and go down to $109,500 or lower.
Intraday scalpers are looking at $112,200 for possible chances to buy back in. Any recovery must happen with a lot of volume to show that it is strong. If not, sideways grinding means that the market is becoming more vulnerable to breakouts to the downside.
Recommended Article: Bitcoin May Join Gold on Central Bank Balance Sheets by 2030
Oscillators Show Signals That Are Neutral to Bearish
The RSI is currently around 42, which shows that momentum is slowing down but there isn’t a clear direction. Stochastic oscillators show that the market is oversold, and CCI shows that there is bearish pressure at minus seventy-three. ADX is still weak at seventeen, which shows that the market is not sure what to do.
Bearish momentum indicators include the Awesome Oscillator and MACD. The MACD reading of -48 shows that there is still a risk of going down. In general, oscillators show that short-term sentiment is mostly neutral to bearish.
Bitcoin Must Reclaim $114K Daily Resistance to Restore Market Credibility
Moving averages for short and medium terms, from ten to one hundred periods, show bearish trends. The only signs of hope are long-term two-hundred-period averages, but these signals seem to be getting weaker and weaker. If the price doesn’t go back up to higher levels, it will stay bearish across all time frames.
Bitcoin needs to get back above $114,000 and stay above resistance every day to regain credibility. Otherwise, long-term hope may turn into more drops. Moving averages now strongly favor sellers.
Bullish Scenarios Require Strong Confirmation
Bulls need to get back to $113,500 with a lot of trading volume to cancel out short-term bearish patterns. If the price closes above $114,000, it could start a rally to cover shorts and move higher. This kind of momentum would bring back hope, at least for a while, for investors who have been on the sidelines.
Long-term moving averages still show underlying strength, but they could fade quickly. If the buying volume doesn’t come back, the chances of recovery go down quickly. Bulls are still alive, but their last chance depends on resistance breakouts.
Bearish Risks Are Still Stronger Than Hopes for Recovery
Bitcoin could drop to $107,000 or even $105,000 if support at $111,000 doesn’t hold up. In the current setup, oscillators, moving averages, and momentum indicators all point to bears. In this situation, the risk is very much on the downside.
People in the market are still wary of traps and false breakouts, and caution is the main feeling right now. The downside is still the main theme until bulls get back on their feet. Failure at $111,000 confirms that the market is going down even more.
Bitcoin Faces Critical $111K Support as Selling Pressure Intensifies Risk
Bitcoin is facing its most important test in a long time, and $111,000 is the last line of defense. If this level is broken, selling pressure may increase, which would hurt confidence in a quick recovery. Holding it could cause short-term rallies to hit resistance.
Overall, people are feeling bearish, but there are chances if the momentum changes in a big way. Bitcoin’s short-term path will be set by the next few sessions. Traders wait for confirmation of volume before making directional bets.


