
Bitcoin Holds Recovery Gains Amid Resistance at $118,000
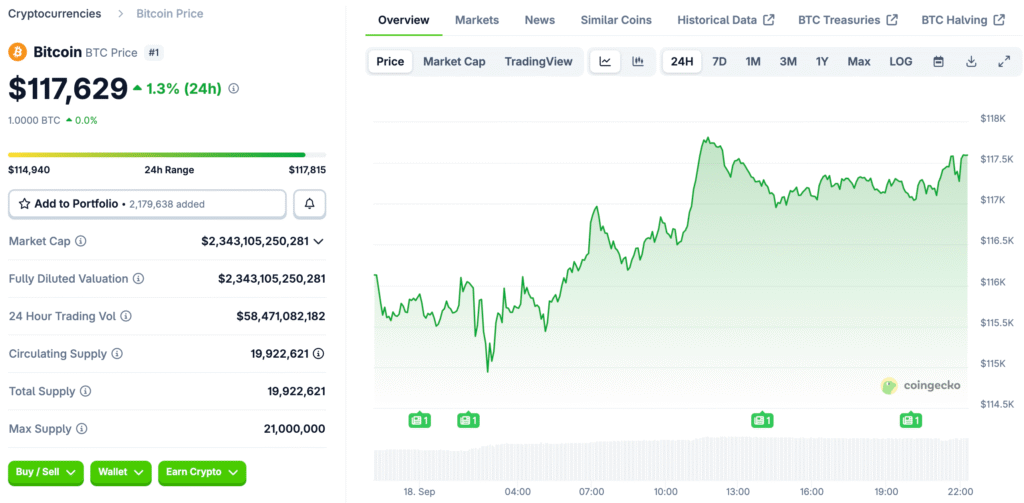
Bitcoin’s price is $117,629, with a market value of over $2.34 trillion. High trading volumes indicate investor interest but caution. The price shows a rounded bottom recovery pattern, suggesting a change in trend. However, lower volumes reduce sustainability, making people more cautious.
The $118,000 resistance level is crucial for profits, and a strong breakout could prolong rallies. Neutral oscillators increase uncertainty, so traders constantly monitor signals for market breaks or reversals.
Technical Patterns Suggest Recovery but Warn of Fatigue
The daily chart shows the formation of a rounded bottom. Volume divergences, while helpful, show that the excitement behind the recent upward momentum is fading. Without participation, relief rallies often lose their energy. Confirmation needs more volume; otherwise, upward movements could go back down to support.
The $120,000 level can only be reached with a clear breakout. Without more people being sure they want to buy, momentum will not be strong enough across the board. Patterns show hope but also call for discipline. For trend continuation to happen, volume must return; otherwise, near-term positions are still at risk of correction.
Four-Hour Chart Shows Consolidation After Breakout Attempt
Bitcoin held steady between September 13 and 16 before breaking out toward $117,934 on higher volumes, which showed that the accumulation momentum was back. Since then, the price has stayed close to $117,000, which is what happens when continuation setups form in healthy bullish market structures.
It is still important to stay above $116,500. A long period of consolidation here gives the next breakout attempt toward overhead resistance near $118,000 a stronger base. Failure increases the chances of a reversal. Traders see $116,000 as a secondary entry zone and carefully line up entries with support confirmations on shorter timeframes.
Recommended Article: Metaplanet Expands Bitcoin Strategy with US and Japan Units
Hourly Chart Highlights Cup and Handle Breakout Formation
The one-hour chart demonstrates a cup and handle pattern, with a breakout near $117,934 confirming a bullish structure. The consolidation appears to be a bull flag, potentially continuing if volume returns and resistance clears near $118,000.
Traders are waiting for a strong re-entry above $117,800 to $118,000 before confirming a price increase. If it goes below $116,500, the bullish bias is invalid, and the price could return up. It’s crucial to monitor both aggressive and defensive traders.
Oscillators Send Mixed Signals to Momentum Indicators
The RSI is neutral, the stochastic oscillator is overbought, and the commodity channel index is positive. The ADX is weak, and the Awesome Oscillator signals cautious optimism. The momentum indicator is bearish, and the MACD is bullish, supporting optimism.
Mixed readings indicate doubt, and traders view oscillators as signs of caution. They try not to be too sure of themselves during market consolidation. Traders should be cautious when interpreting oscillators.
Averages Moving Help Long-Term Positive Mood
Shorter averages, like the ten-day EMA and SMA around $115,400, show that the market is bullish, which is in line with where Bitcoin is currently trading. Support is strengthened by medium-term averages. The fifty-day EMA and SMA stay bullish, showing that they are strong even though momentum is slowing down in shorter time frames.
Long-term indicators are very bullish. The 200-day EMA is at $105,631 and the SMA is at $103,088, both of which are well below the current price levels. This alignment suggests that Bitcoin’s structure is still strong. The long-term trend supports going higher if the resistance at around $118,000 is broken.
Bull’s Eye Breakout Toward the $120,000 Resistance Target
If Bitcoin breaks through $118,000 with volume, the bullish case gets stronger. Chart patterns show that the price could continue to rise toward $120,000 and beyond. Moving averages make people feel better. The long-term uptrend is still in place, which makes the case for renewed momentum that will drive Bitcoin much higher in all markets.
A decisive break confirms the breakout. Bulls could benefit from a sustained upward trend, a longer rally, and a confirmation of the recovery leg toward higher valuation levels. Without confirmation of a breakout, optimism is still just a guess, waiting for proof of strength beyond immediate resistance levels in shorter-term setups.
The Bearish Outlook for Bitcoin’s Momentum
The bearish scenario shows that the resistance at $118,000 was not broken. If the momentum stays weak, prices could drop back to $116,500 or lower. Falling volumes and waning oscillator signals point to possible exhaustion, framing the recent rally as a temporary relief bounce that won’t last.
If it fails, it could drop even more to $112,000 or $114,000. Traders need to stay disciplined and be careful about how much risk they take on when things are uncertain. Bears argue without volume or conviction, which could make Bitcoin’s breakout potential less likely and make investors more cautious while they wait for more information.