
Understanding the Current XRP Market Position
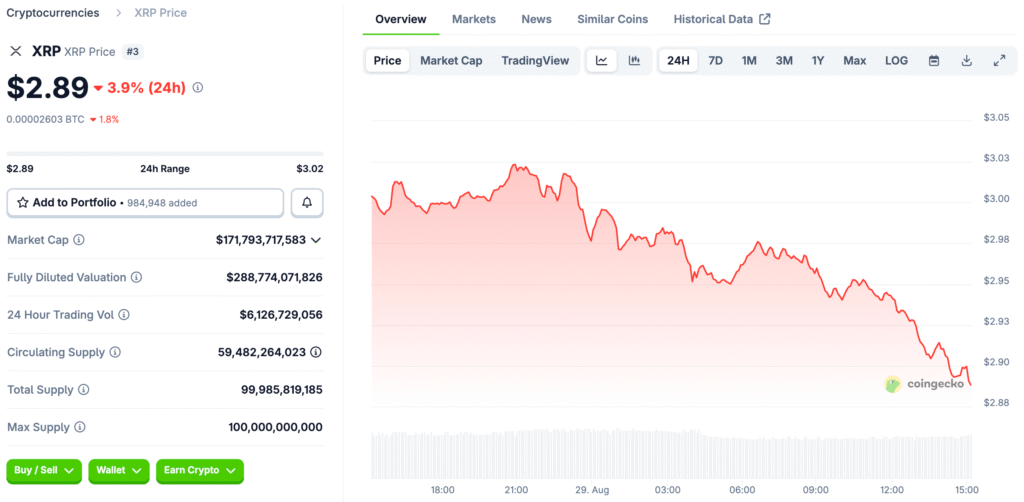
Ripple’s XRP token is showing signs of recovery. It is currently positioned above a key support level. This consolidation suggests a growing stability in the market. Traders are observing these levels closely for future moves.
Interest in the remittance token has been steady. The futures weighted funding rate is now rising. This trend points toward positive market sentiment. It shows more traders are opening long positions.
Analyzing the Spent Output Profit Ratio
The Spent Output Profit Ratio is a key metric. It measures the value of sold tokens. This is compared to the price that was originally paid. A value above one means that holders are selling at a profit.
The SOPR for XRP has been moving downward. It is now getting closer to the ratio of one. This indicates that investors are reluctant to sell now. They may be anticipating a further price increase.
Exploring the Net Unrealized Profit and Loss
The Net Unrealized Profit/Loss shows investor sentiment. It reveals the overall profit or loss status. A reading near 0.5 signals a potential local bottom. This is a common pattern in the market.
Investors may use this level to increase exposure. They could be anticipating a price increase soon. This metric shows a potential for an upcoming breakout. It suggests the cycle is reaching a turning point.
Recommended Article: XRP Price Drops 3% Despite Gemini-Ripple Credit Card Partnership
The Role of Futures-Weighted Funding Rates
The futures weighted funding rate is rising. It indicates an increase in long positions. This growth backs a positive market sentiment. It increases the chance of a short-term bullish move.
More traders are now leveraging their long positions. The funding rate growth will help this positive trend. A stronger trend supports a higher probability of a breakout. It shows growing confidence among investors.
Technical Indicators and Market Indecision
The Relative Strength Index, or RSI, is a key tool. It is currently moving sideways below the midline. This indicates a period of market indecision. Traders are waiting for more clear direction.
The Moving Average Convergence Divergence, MACD, is also sideways. This suggests a push and pull between buyers and sellers. The market is waiting for a strong trend to form. Both indicators show a lack of momentum right now.
XRP at a Crucial Support Level
XRP is trading near a crucial support level. The 50-period exponential moving average provides this support. This helps to back the short-term bullish sentiment. It is an important level for traders to watch.
The next resistance level is also being watched. A break above this level could signal more gains. However, a drop below the EMA could mean a decline. This creates a critical range for price action.
Forecasting the Bullish Breakout Potential
Several on-chain metrics point to a breakout. The SOPR and NUPL metrics signal bullish potential. They show that investors are holding on to their coins. This supply shock could lead to higher prices.
The technical indicators are also aligned with this view. The current consolidation period is a key sign. All these factors combined suggest a strong possibility for an upward move. Traders should watch for a confirmation of this trend.