Bitcoin Consolidates Near a Crucial Support Level
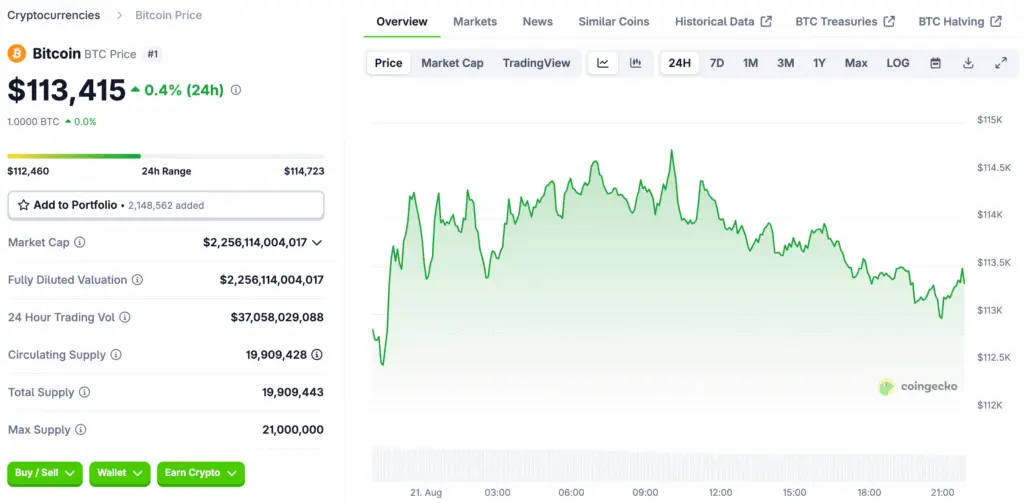
Bitcoin’s price is showing signs of consolidation, trading in a narrow range between $113,524 and $113,882. The leading cryptocurrency has a formidable $2.26 trillion market cap, with a daily trading volume of $45.41 billion. This period of price consolidation is occurring near a critical support level, as traders and analysts brace for potential market-moving events.
The current market action reflects a combination of technical patterns and macroeconomic headwinds, making the price movements particularly sensitive to upcoming news, especially from key figures like Federal Reserve Chair Jerome Powell. The narrowing range suggests that the market is holding its breath, waiting for a catalyst to determine its next major move.
A Downtrend Confirmed on the Daily Chart
A closer look at Bitcoin’s daily chart reveals a clear downtrend that began after a sharp rejection at the $124,517 level. This price point was the peak of a double-top pattern, which has since initiated a series of lower highs and declining closes. A significant volume spike at this local high confirms that large-scale distribution occurred, signaling a bearish sentiment among market participants.
The most recent price candles show a degree of hesitation at the $112,000–$113,000 support zone. This area has a historical significance, aligning with previous demand zones and a short-term bounce. For the bulls, this level is pivotal; a failure to hold it could lead to a deeper retracement below the psychological $110,000 level.
Mid-Term Signals from the 4-Hour Chart
Zooming in on the midterm picture, the 4-hour Bitcoin chart reflects a controlled downtrend channel that has been in place since August 13. While a modest bounce from $112,580 has emerged, its strength remains unconvincing. For this bounce to be considered a potential trend shift, a decisive breakout above the $115,500–$116,000 resistance band is necessary.
Volume clusters around recent lows hint at a potential period of capitulation, where weaker hands are selling off their holdings. However, without a strong influx of bullish momentum, the market remains cautious. A sustained close above $116,000 would be the first true indication of a trend reversal, while a rejection from this zone could invite renewed selling pressure.
Read More: All Bitcoin Wallet Cohorts Now in Distribution Mode, Glassnode Data
The Short-Term Outlook on the 1-Hour Chart
The 1-hour chart provides a more granular view of the current price action, suggesting that Bitcoin may be forming a short-term bottom. Recent candles have posted higher lows and slightly higher highs, indicating a potential shift in momentum on a very short time frame. The price is currently well-supported around $113,000, with visible indecision reflected in declining trading volume.
For short-term traders, this creates an environment for range-based strategies. Opportunities may exist for scalping long entries near the support and taking profits near the $114,500–$115,000 ceiling. However, if this upper boundary rejects with strong volume, short positions could reassert their dominance, signaling a continuation of the downtrend.
Decoding the Momentum Indicators
The current market sentiment is further illuminated by a mixed but slightly bearish picture painted by various momentum indicators. The Relative Strength Index (RSI) sits at 43 and the Stochastic oscillator is at 14, both of which indicate neutral conditions. However, the Commodity Channel Index (CCI) is at -96 and the Average Directional Index (ADX) is at 19, reflecting weak directional momentum.
More bearish signals are being flashed by the Momentum indicator at −5,526 and the Moving Average Convergence Divergence (MACD) at −66. These bearish signals add a clear downside bias to the short-term outlook, suggesting that the current consolidation is more likely a pause before another move lower, rather than a strong accumulation period.
How Macro Factors Are Shaping Bitcoin
Bitcoin’s latest pullback is not just a result of technical patterns; it is also a reaction to a combination of institutional repositioning and broader macro factors. The recent announcement from Strategy about eased share issuance restrictions fueled fears of dilution, which dragged sentiment lower and caused its stock to slide 7.4% against the U.S. dollar.
This institutional move had a ripple effect on the broader crypto market. Concurrently, a breach of the $114,500 support level triggered algorithmic sell orders and massive liquidations, compounding the downside pressure. Furthermore, U.S. spot Bitcoin exchange-traded funds (ETFs) posted $523 million in net outflows on August 19, led by Fidelity and Grayscale. This reduction in market liquidity is a key factor as traders await the upcoming Jackson Hole address.
Bitcoin’s Immediate Future in Balance
The immediate future for Bitcoin hangs in a delicate balance. A bullish outcome would require the price to maintain support above $112,500 and then break decisively through the $116,000 resistance level with rising volume. A sustained close above this point would be a crucial victory for the bulls, potentially initiating a retest of the $118,000–$120,000 zone.
Conversely, the bearish verdict suggests a continued downside. A failure to hold the $112,000–$112,500 support band, especially in the face of ongoing ETF outflows and bearish momentum signals, may accelerate the decline toward $110,000 or lower. The ultimate direction of the market will likely be determined by the outcome of Powell’s Jackson Hole address and the subsequent investor reaction.